
This project is a product of its time. Born in the depths of the 2020 lockdown, it began as a simple way for a group of friends to track our weekly film selections. But, as we all started going a bit stir-crazy, the project morphed into a slightly over-the-top hub for our increasingly elaborate film statistics and awards ceremonies.
The overall goal was simple, a low maintenance tool to let everyone see what films the others had chosen, but seeing as I had the time, I wanted to see how far I could push it.
Next.js static site generation
The architectural backbone is Next.js. Since the film club only met once a week, there was no reason to have a “live” database connection spinning 24/7. This was also a silly hobby project, so I didn’t want to spend money on hosting.
I opted for full Static Site Generation (SSG). Every time the club met I could fetch the new film via an admin page I built locally, and have the entire site rebuild from the new database. This means users get a lightning-fast, pre-rendered experience with a massive amount of metadata for films and actors, all without the overhead of a traditional server-side setup. This was a great fit for the project and allowed me a very cheap and fast way of keeping things up to date, though definitely not scalable.
Going for graph
While a spreadsheet or a basic SQL table would have sufficed, lockdown boredom led me to try Neo4j. I’d seen some talks about graph databases and was interested in trying them out with some real relationship based data.
In a graph database, data is expressed as nodes and relationships. The movie relationship data is a standard candidate for graph ‘Getting started’ examples, but our data was a really good candidate for a graph database. I wasn’t just tracking titles but selection histories, actors and directors, and the linking of our internal awards. To handle the schema, I used Arrows, a visual mapping tool that lets you draw your data entities like a whiteboard diagram and export a GraphQL schema.
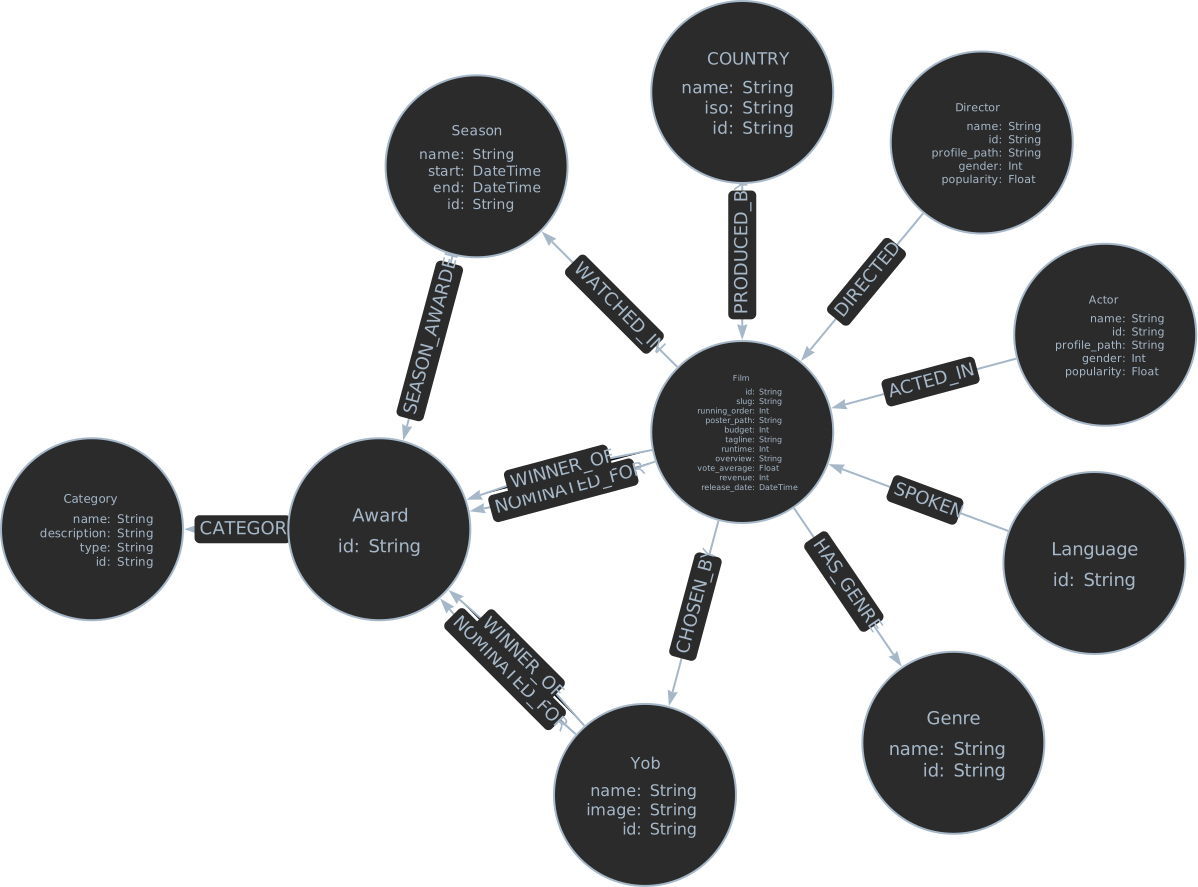
I was able to build relationships to track all selections by each member, cross reference this with actors, ratings and more. All of this is captured directly in the edges, references to the relationship between two entities. This is the entire database structure, and it was very easy to scale and grow the dataset, like adding the awards element, linking awards to films and the members that chose them.
Querying by relationship
The real fun of a graph database is the “multi-directional” nature of the data. If I want to see every film a certain actor has appeared in within our club’s history, I don’t need to write complex joins. I just query the relationship.
const { films } = await query(`
    { films (where: {slug: "${context.params.id}"}) {
          title
          actorActedIn (options: { sort: [{ popularity: DESC }] }) {
            name
            profile_path
            actedInFilmConnection {
              edges { roles }
            }
          }
        }
    }
  `)
This snippet shows the power of graphs. We can pull a film, its entire cast (sorted by popularity), and all their other roles in one clean sweep. It’s a level of query that probably wasn’t strictly necessary for a hobby project, but it made the development process a lot more interesting. And allowed for super easy ways to aggregate data, such as the individual member and stats pages.
Over-Engineering because I want to
There is a definite barrier to entry with Neo4j and GraphQL. The syntax is very different and quite verbose, and it’s a steep learning curve compared to a standard SQL app.
However, when you’re building an over-the-top side project to celebrate an over-the-top awards ceremony, easy isn’t the point. If your data is inherently relational and you have the time to go down the rabbit hole, mapping your database to the actual taxonomy of life (or your film club) is an interesting project for a future lockdown.